Daily Technical Analysis For Majors By Forex4you Daily Technical Analysis For Majors By Forex4you |
|
|
| trevor_l |
 Apr 11 2012, 12:55 PM Apr 11 2012, 12:55 PM
|

Junior Money Maker

Group: Members
Posts: 36
Dream Points: 230
Experience Points: 86
Joined: 11-April 12
Member No.: 268,237

|
Technical Analysis 11th April 2012
GBP/USD
Level 1.5930 became a resistance for the sideways range. Having made another attempt to breach this level, trading is now retracing back down. At the moment it's being carried out at 1.5890/80 levels. Indicators are still "bearish", but they seem to be weakening. However, we still expect a decline towards the auxiliary trend line (blue dashed line) and then towards 1.5760/70, 1.5650/40 � 1.5600 levels. Reversal up and fixation above 1.6000 will, on the other hand, indicate a reversal up.
USD/CHF: rebound likely
The swissie is moving sideways with a slight downside bias. It pulled back from resistance from the upper channel-line at the 0.9200 highs and has since dropped to support at the lower channel- line or floor of the consolidation at 0.9130. This level is further reinforced by support from the 200-4hr MA and the 50-1hr MAs as well as the weekly pivot at 0.9127. Therefore I�d expect it to probably reverse and rise from here to re-touch the 0.9200 highs again, although a breakdown is still a slight possibility with the support at 0.9090 eyed initially, followed by 0.9059.
USD/JPY
The price breached downtrend channel's support (blue lines), which indicated further "bearish" scenario. Trading descended to 80.60/50 level, where it's still carried out. Indicators suggest another decline, which gives reasons to anticipate a plunge to the next target at 79.90/80 support, mentioned earlier. However, the price has all chances to reverse up from this barrier on the way down and recommence its bullish trend. Growth above 83.40 resistance will be a sign for reversal up. At the same time, the price can rise from the current local minimums too - 80.50/60 level is a strong support at the moment.
EUR/USD
This pair is trading in a range between 1.3150 and 1.3040 and this could continue for a little longer. There is substantial support and resistance at the range lows; momentum is strong on the recent fall and there is the possibility of a breakout from the range to the downside, with an eventual target at 1.2835 initially and then the former 1.2640 lows. A rebound higher, however, cannot be discounted, with the range highs at 1.3300 providing an upside target.
Analysis prepared by:
Joaquin Monfort and Arkady Nagiev
Forex4you analysts
Disclaimer:
Trading Futures and Options on Futures and Cash Forex transactions involves substantial risk of loss and may not be suitable for all investors. You should carefully consider whether trading is suitable for you in light of your circumstances, knowledge, and financial resources. You may lose all or more of your initial investment. Opinions, market data, and recommendations are subject to change at any time.
--------------------
|
|
|
|
|
|
|
  |
Replies(1 - 9)
| trevor_l |
Apr 12 2012, 01:12 PM
|
Junior Money Maker
Group: Members
Posts: 36
Dream Points: 230
Experience Points: 86
Joined: 11-April 12
Member No.: 268,237
|
Technical Analysis 12th 2012
GBP/USD
"Bullish" attempt to push the price up halted at 1.5930 level. Trading is currently carried out at 1.5860/70. 1.5830/40 support keeps on holding back the "bears". Indicators suggest dominating bearish sentiment, R% turned down, saying in favor of this scenario. Therefore it's worth expecting a decline towards the auxiliary trend line (blue dashed line) around 1.5760/70 price range. Dissension towards 1.5650/40 � 1.5600 supports is also a possibility. Should the price retrace up and hold above 1.6000 level, sentiment will change towards the "bullish".

AUD/USD
The price failed to decline towards 1.0220/30 target, mentioned in the previous comments, and consolidated slightly above, suggesting to anticipate volatility. Trading is currently carried out at 1.0290 level. Indicators are "bearish", which gives enough reasons to expect further decline, may be even towards 1.0140/30/50 supports. 1.0220/30 level breakout will be a sign of a strong "bearish" potential. Should the price, on the other hand, escape from a downtrend channel (blue lines) and breach 1.0440/50 resistance, we'll be expecting a reversal up and strengthening bullish sentiment.

EUR/USD
The price kept on consolidating within narrow ranges. Forecasts confirmed - the "bulls" attempted to test the auxiliary trend line (blue dashed line) as a resistance, but failed - trading reversed down and is now carried out at 1.3100/10. Indicators are mostly "bearish", which gives reasons to expect further dowtrend and another decline towards earlier mentioned 1.2970/80 support range and then lower, to 1.2870/80 and 1.2750 levels. If the price retraces towards the uptrend channel sector and holds above 1.3170/80 level, we'll be expecting the change of market sentinent. Growth above 1.3290/1.3300 level will be the final signal for reversal up.

Analysis prepared by:
Joaquin Monfort and Arkady Nagiev
Forex4you analysts
Disclaimer:
Trading Futures and Options on Futures and Cash Forex transactions involves substantial risk of loss and may not be suitable for all investors. You should carefully consider whether trading is suitable for you in light of your circumstances, knowledge, and financial resources. You may lose all or more of your initial investment. Opinions, market data, and recommendations are subject to change at any time.
--------------------
|
|
|
|
|
|
| trevor_l |
Apr 13 2012, 01:20 PM
|
Junior Money Maker
Group: Members
Posts: 36
Dream Points: 230
Experience Points: 86
Joined: 11-April 12
Member No.: 268,237
|
Technical Analysis 13th April 2012
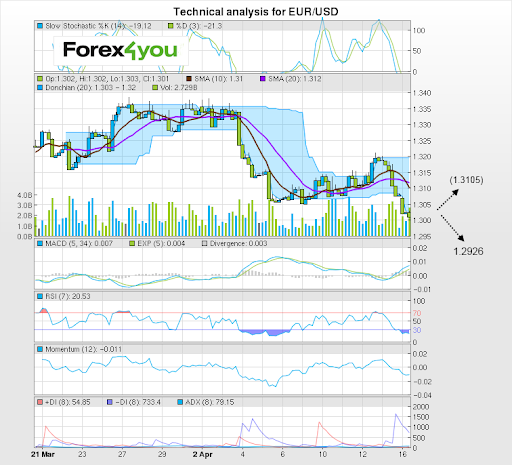
EUR/USD: downmove expected
The eurodollar has started falling after hitting resistance at around the 1.3210 level, made up of several major MA's as well as a weekly pivot. This has led to a corrective move down. It is possible we are witnessing a resumption of the down-trend off the April highs, which could be an Elliot 5th wave, targeting the old lows. RSI has also just given a sell signal, and it is probable that the pair will now fall with major support at 1.3103 where the S1 monthly pivot is. There may be a recovery at that level, although eventually it will probably resume the down-trend to the old lows at 1.3035.

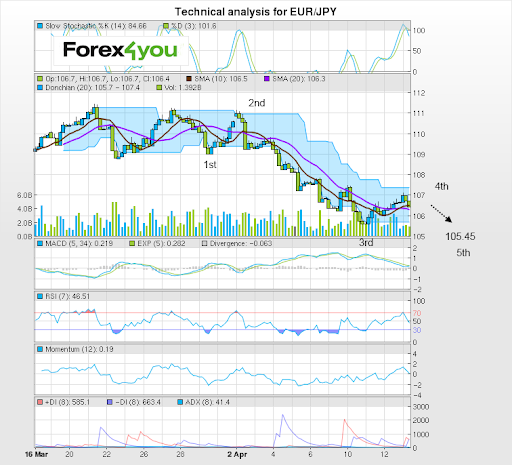
EUR/JPY: wave 5
The EUR/JPY pair has started to fall after touching resistance from the 50-day MA at the 107.15 level. This is probably a 5th Elliot wave of the move down from the March highs and it will probably fall to re-touch the lows at 105.45. After that a deeper break could occur if the head and shoulders pattern on the daily charts breaks its neckline and falls, with 101.75 targeted initially and possibly even 99.75 longer-term.
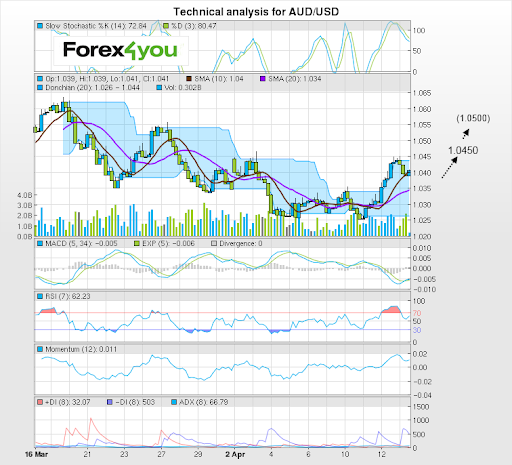
AUD/USD: uptrend resumes
The aussie has fallen back to support from the channel which it recently broke out of and has posted a hammer candle-stick signalling a resumption of upside. It will now probably rise back up to retouch the recent 1.0450 highs, possibly in an Elliot wave 5 of the move. There may be further follow through higher too - to resistance from the monthly pivot in the 1.0500 area, which is also the objective for the channel break out and a Fibonacci level.
GBP/USD
The price breached 1.5930\50 resistancem but the "bulls" managed to push the trades only up to 1.5980/90 level, wherefrom the price recommenced its decline. Tarding is currently carried out at 1.5920/30 levels. Indicators are unclear and the situation is now uncertain. As there have been no signs of a possible reversal up, it's worth expecting further decline to 1.5810/20 and then to 1.5760/70 level. If the price recommences its growth, breaches and holds above 1.6000 resistance, which is now considered to be the key barrier on the way up, market sentiment will turn "bullish".

Analysis prepared by:
Joaquin Monfort and Arkady Nagiev
Forex4you analysts
Disclaimer:
Trading Futures and Options on Futures and Cash Forex transactions involves substantial risk of loss and may not be suitable for all investors. You should carefully consider whether trading is suitable for you in light of your circumstances, knowledge, and financial resources. You may lose all or more of your initial investment. Opinions, market data, and recommendations are subject to change at any time.
--------------------
|
|
|
|
|
|
| trevor_l |
Apr 16 2012, 01:26 PM
|
Junior Money Maker
Group: Members
Posts: 36
Dream Points: 230
Experience Points: 86
Joined: 11-April 12
Member No.: 268,237
|
Technical Analysis 16th April 2012
EUR/USD: bearish outlook
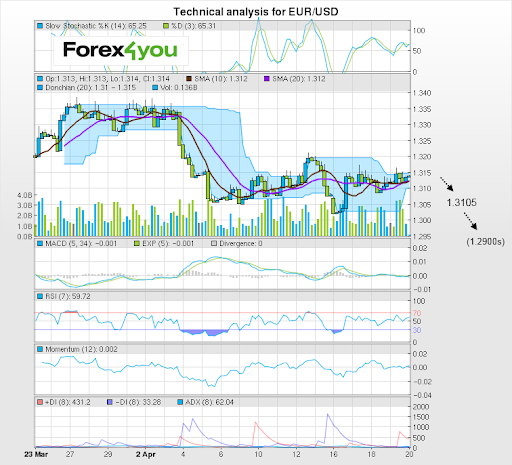
Eurodollar fell on Friday in an Elliot wave 5 down as anticipated. There is a possibility it has found support at the lows and is in the process of mounting a recovery. A correction now could see it bounce back to resistance from MA's and pivots clustered around 1.3105. My slight preference, however, is for a continuation lower to the next target down at the weekly pivot at 1.2926, which would fulfil the target of the measuring gap created last night.
USD/JPY
The pair is making another attempt to test 80.50/60 support. Trading is carried out around these levels. "Bearish" potential is strong enough, which gives reasons to anticipate another decline to 79.90/80 support. On the other hand, MACD divergence suggests being cautious - not only a pullback up within the uptrend is possible, but also a reversal towards the medium term uptrend. Growth above 81.90/80 resistance will be a signal for big changes in the market sentiment.

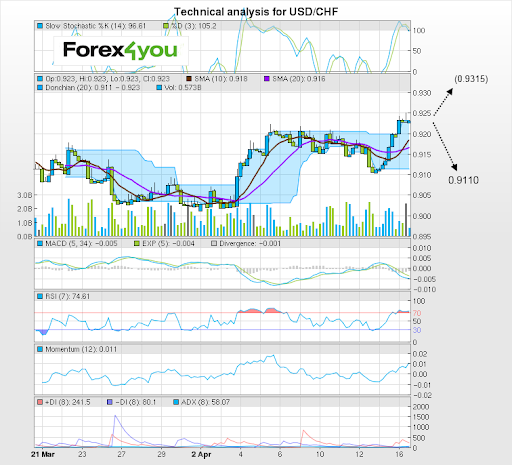
USD/CHF: meeting resistance
The swissie has reached a tough resistance level which may prove a barrier to further progress given includes the weekly and monthly R1 pivots and the 100 day-MA. The pair is already beginning to pull-back and despite a strong rally so far , I see the possibility of a major correction from here to perhaps 0.9110 lows. However there is still a slight chance � given the strength of the uptrend - that there could be a breakout higher, with a target at 0.9315 where the move from 3rd of April achieves wave equality.
GBP/USD
Market picture has changed - the price descended to 1.5810/20 support and is now making attempts to test it. The barrier is strong, especially now that it matches with the auxiliary trend line (blue dashed line), so current decline may halt for a while. Indicators have turned more bearish, which might be a sign of further decline. Should the price breach currently tested level, we'll be expecting another dissension towards the next target at 1.5760/70 level, mentioned earlier, which will be a signal for further sell off, so the price may reach 1.5710 level and then proceed towards 1.5650/00 support range. Should the price rise and hold above 1.6000 level, we'll be expecting a medium-term reversal up.

Analysis prepared by:
Joaquin Monfort and Arkady Nagiev
Forex4you analysts
Disclaimer:
Trading Futures and Options on Futures and Cash Forex transactions involves substantial risk of loss and may not be suitable for all investors. You should carefully consider whether trading is suitable for you in light of your circumstances, knowledge, and financial resources. You may lose all or more of your initial investment. Opinions, market data, and recommendations are subject to change at any time.
--------------------
|
|
|
|
|
|
| trevor_l |
Apr 17 2012, 12:39 PM
|
Junior Money Maker
Group: Members
Posts: 36
Dream Points: 230
Experience Points: 86
Joined: 11-April 12
Member No.: 268,237
|
Technical Analysis 17th April 2012
EUR/USD: correction maturing
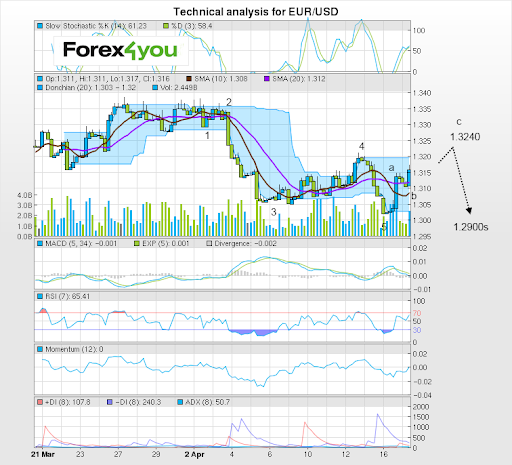
A classic A-B-C correction is under-way following the completion of an Elliot wave down which started at the late March highs. Waves A and B appear to have completed and C may end at 1.3240 where it would achieve wave equality with A and touch the monthly pivot. It is also possible it may fall short and another target for the end of the rally is at the old highs of 1.3212. Once complete the down-trend will probably resume with the next cycle probably making new lows below 1.2994.
EUR/JPY: downside possible
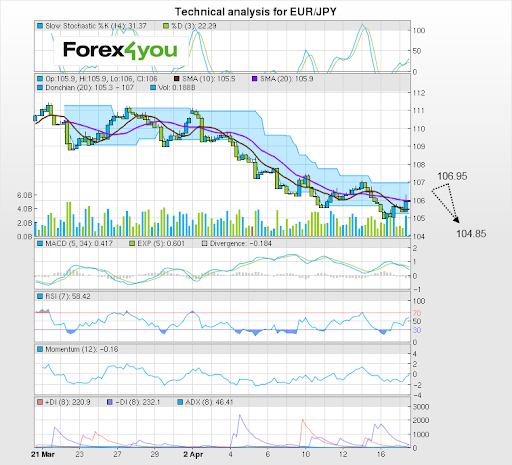
This pair has found resistance at the highs from moving averages and the weekly pivot after correcting the previous strong move down. It has taken the form of an A-B-C three wave correction with wave C currently reaching just shy of wave equality with A at 106.45. The move will probably roll-over and the down-trend resume. Downside targets include the former lows initially at around 104.85 and then 100-day MA at 104.10. If there is a continuation higher, however, then 106.95 could form the next upside target although eventually downside should predominate.
GBP/USD
1.5810/20 support (secondary trend line) proved its strength and held back all bearish attacks. Trading climbed towards 1.5930/20 resistance, which, if breached, will indicate the change of sentiment in the market. Indicators are turning, giving even more reasons to be cautious. SS in turned down, slightly calming down rising concerns. As long as level 1.6000 is safe, bearish sentiment should be considered dominating - new local minimums at 1.5760/70, 1.5710 levels and 1.5650/00 support range are likely to be tested
anytime soon.

USD/JPY
The price continued its attempts to breach and hold below 80.50/60 support. Having reached 80.30 level, trading is now pulling back up and being carried out at 80.70/80 level. However, the fact that SS is being oversold suggests to consider current growth to be another correction and a downtrend may recommence anytime soon. Earlier forecasts are still relevant - final ascension towards 79.90/80 support should commence, then a medium downtrend should begin. Growth above 81.90/80 resistance will be a signal for serious changes in market sentiment.

Analysis prepared by:
Joaquin Monfort and Arkady Nagiev
Forex4you analysts
Disclaimer:
Trading Futures and Options on Futures and Cash Forex transactions involves substantial risk of loss and may not be suitable for all investors. You should carefully consider whether trading is suitable for you in light of your circumstances, knowledge, and financial resources. You may lose all or more of your initial investment. Opinions, market data, and recommendations are subject to change at any time.
--------------------
|
|
|
|
|
|
| trevor_l |
Apr 18 2012, 04:46 PM
|
Junior Money Maker
Group: Members
Posts: 36
Dream Points: 230
Experience Points: 86
Joined: 11-April 12
Member No.: 268,237
|
Technical Analysis 18th April 2012
EUR/USD: correction unfolds
The eurodollar pair completed its upside correction and then began falling as expected. At the same time a head and shoulders pattern broke its neckline and the exchange rate also pierced through major support at 1.3105. It will probably move down to reach the H&S target at 1.3040, however after that there is the possibility of a bounce as downside has been a little weak so far and it is possible the new cycle lower hasn't begun yet. There may be another correction first, with perhaps 1.3185 targeted or even 1.3212.

USD/JPY
"Bears" failed to push the trades down below 80.35 level, the price continued its growth and now resides at 81.50/60 level. Looks like MACD divergence has realized and indicators have turned up, suggesting further ascension. However, until the price breaches 81.80/90 resistance, trading has all chances to recommence a decline any time. Therefore, it's worth expecting another attempt to breach 79.90/80 resistance. Growth above 81.90/80 resistance will be a signal to expect medium-term growth.

EUR/GBP: bearish breakout
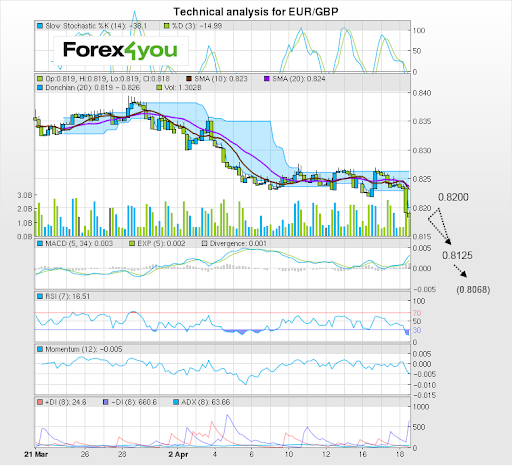
The EUR/GBP pair has made a sudden break lower, out of the channel it was moving down within, yielding a downside target of 0.8068, using the width as a guide. This happens to be only 2 pips above the July 2010 major lows at 0.8066 and indicates the possibility the lows could be reached. Currently it appears to be putting in a dragon-fly doji on the 4-hr chart at the S3 weekly pivot and there is the possibility of a base forming and a temporary bounce to resistance at 0.8200. After that I see a strong possibility of a resumption of the fall with the 0.8068 level targeted eventually, although the monthly pivot at 0.8125 could also be reached.
GBP/USD
1.5930/20 resistance, mentioned earlier as one of the key resistances, indicating a reversal, was breached, but trading retraced below this level, so the breakout has to be now considered false. However, the price can make another attempt to recommence growth too, so the situation is rather uncertain. Should the price hold above 1.5930 level, trading will turn up and the price will ascend to 1.6000 level. Reversal down, below 1.5870 level will indicate bearish potential and, therefore, suggest further decline towards new local minimums at 1.5760/70, 1.5710 and 1.5650/00 levels in the near future. 1.6000 level breakout will be a signal for reversal up in a medium-term.

Analysis prepared by:
Joaquin Monfort and Arkady Nagiev
Forex4you analysts
Disclaimer:
Trading Futures and Options on Futures and Cash Forex transactions involves substantial risk of loss and may not be suitable for all investors. You should carefully consider whether trading is suitable for you in light of your circumstances, knowledge, and financial resources. You may lose all or more of your initial investment. Opinions, market data, and recommendations are subject to change at any time.
This post has been edited by trevor_l: Apr 18 2012, 04:46 PM |
|
|
|
|
|
| trevor_l |
Apr 19 2012, 01:11 PM
|
Junior Money Maker
Group: Members
Posts: 36
Dream Points: 230
Experience Points: 86
Joined: 11-April 12
Member No.: 268,237
|
Technical Analysis 19th April 2012
EUR/USD: correction completing
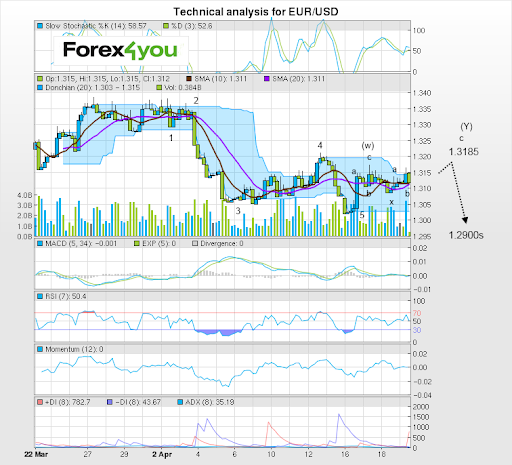
The EUR/USD pair has continued to consolidate. It is possible that it is near to completing a double zigzag at the current highs, which started on the 16th � as labelled on the chart below. There is a possibility that it could go a little higher to the monthly pivot at 1.3185 where waves A and C would achieve equality � or even 1.3212 if C is longer. After that there is a strong possibility of the next cycle starting and reaching below the 1.2994 lows. The double correction may extend to a triple too but not beyond. The new impulse down will probably be characterised by its unusual strength.
GBP/USD
Earlier forecast, expecting possible growth, confirmed. The price breached 1.5930/20 resistance and then level 1.6000, mentioned earlier as the key barriers for reversal up. The price is now testing the next resistance at 1.6060 resistance. Indicators are turned up, suggesting further growth. However, currently tested level is just the first bound of 1.6060-16090/1.6100 resistance range, so the bulls have a long way to go. Should the price breach this barrier on the way up, it will proceed towards the next strong resistance at 1.6160/70 level, which has already held back the bulls once, in October 2011. In case the price fails to ascend further, it'll most likely correct towards 1.6000 support. If the expected pullback continues below 1.5960/50 level, we'll be expecting a reversal down.

EUR/JPY: meeting resistance
The potential for a roll-over at this level is quite high. The weekly and monthly pivots are both in the 106.90s and a on the 4-hr chart a 2- bar reversal is forming which also has bearish connotations. RSI is showing divergence at its peaks and MACD is looking overextended. The pair could fall to 106.20 where it will meet support from moving averages on several time frames and then 105.75. It is also possible a new Elliot wave cycle could be about to begin which will eventually take the rate below the 104.60 lows.

Analysis prepared by:
Joaquin Monfort and Arkady Nagiev
Forex4you analysts
Disclaimer:
Trading Futures and Options on Futures and Cash Forex transactions involves substantial risk of loss and may not be suitable for all investors. You should carefully consider whether trading is suitable for you in light of your circumstances, knowledge, and financial resources. You may lose all or more of your initial investment. Opinions, market data, and recommendations are subject to change at any time. |
|
|
|
|
|
| trevor_l |
Apr 20 2012, 02:13 PM
|
Junior Money Maker
Group: Members
Posts: 36
Dream Points: 230
Experience Points: 86
Joined: 11-April 12
Member No.: 268,237
|
Technical Analysis 20th April 2012
EUR/USD: downside possible
Eurodollar could be at important turning point. The correction which began at the lows of the 16th has probably run its course and the larger down-trend may resume quite soon. From an Elliot wave perspective we have probably reached the final zig-zag in a rare triple correction, and this final wave may be ending now at the 1.3180 highs. If there is a move down it will be most tested at the thick layer of resistance at around the 1.3105 level where it could consolidate. This will need to be broken for the move to gain traction but it will probably eventually fall below the 1.2994 lows as the next cycle down unfolds.
GBP/USD
1.6060-1.6090 resistance range held back further ascension like expected. While correcting, the price declined to 1.6000, but then retraced back up and breached 1.6060-1.6090 barrier. At the moment the "bulls" are attempting to hold above, trading is carried out at 1.6100/10 level. Indicators are now "bullish", which gives reasons to expect growth to the next strong resistance at 1.6160/70 level, which has already halted the uptrend at the end of 2011. However, a cluster of resistances above 1.6100 level may hold back ascension. Reversal towards 1.6000 level will trigger doubts of the bullish strength, decline below 1.5960/50 will be a signal for reversal.

AUD/USD
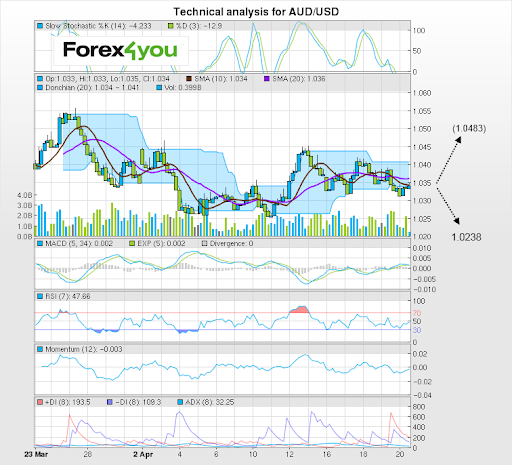
The aussie corrected back to the 1.0345s as predicted. The strength of the earlier rally seems to indicate the possibility of a resumption of the previous up-move, with a target from the channel at 1.0485 and another target at 1.0525 which would give wave equality from the lows of the 11th. The other possibility � which is my preference - is that the current bear move is an Elliot 5th wave from the February highs and will continue lower and reach the former lows at 1.0238. The strong clusters of resistance lying just above the current price action also support this more bearish forecast.
Analysis prepared by:
Joaquin Monfort and Arkady Nagiev
Forex4you analysts
Disclaimer:
Trading Futures and Options on Futures and Cash Forex transactions involves substantial risk of loss and may not be suitable for all investors. You should carefully consider whether trading is suitable for you in light of your circumstances, knowledge, and financial resources. You may lose all or more of your initial investment. Opinions, market data, and recommendations are subject to change at any time. |
|
|
|
|
|
| trevor_l |
Apr 24 2012, 01:36 PM
|
Junior Money Maker
Group: Members
Posts: 36
Dream Points: 230
Experience Points: 86
Joined: 11-April 12
Member No.: 268,237
|
Technical Analysis 24th April 2012
AUD/USD
Strong 1.0300/10 support held back the "bears" for a while, but then the price continued its decline and tested earlier breached downtrend (blue) line around 1.0260/50 levels. Then trading pulled back up and is now carried out at 1.0290/80 level. Indicators are bearish, suggesting further possible decline. However, strong supports at current levels give reasons to be cautious about further dissension - the barrier on the way down is strong enough, so correction within 1.0360-1.0160/50 range is also quite a possibility. Decline below 1.0220/30 local minimum will indicate the bearish strength and give reasons to expect a plunge to 1.040/30 level. Growth above 1.0360 will, on the other hand, suggest a possible reversal towards the bullish trend in a medium term.
GBP/USD
1.6060/50 support held back the "bearish" attacks and prevented the price from holding below. Trading recommenced growth and is now carried out at 1.6150/40 level, which means that the price has approached 1.6160/70 level, mentioned earlier as the target for growth. Indicators have turned more bullish, suggesting further growth. Only MACD divergence suggests a possible pullback, which gives reasons to anticipate a large scale correction from 1.6170/60 resistance. Decline below 1.6120 level will be the first signal for changes, 1.6090/80 support breakout will be the final indication of the upcoming pullback down. If, however, the price breaches 1.6170/60 resistance the bulls will have good chances to test 1.6300 level.
EUR/JPY
The euro-yen pair has consolidated in a sideways range since falling to the 106.30 lows on Monday. It will probably resume its bearish move lower soon with a downside target of 105.60 at the level of the 200-day MA and the weekly pivot. There is less chance it will go higher as the monthly pivot is capping gains at 106.92, however, a move higher might be expected to match the previous highs at 107.99 before extending to satisfy wave equality at 109.70.
EUR/USD: downmove expected
Eurodollar has risen from the 1.3100 lows and now reached the 1.3170s. There is the possibility of some more upside to just shy of 1.3200 which would result in wave equality, but there are lots of bearish signals too. We are at the 61.8% fibonacci retracement of the previous down-move and an obvious place for the rally to stall; there is a shooting star on the hourly and we have reached the 50-day MA, as well as the 200-4hr. It is quite possible the move has completed and the new Elliot wave down will resume. This in turn would be expected to break below support at the 1.3100 lows.
Analysis prepared by:
Joaquin Monfort and Arkady Nagiev
Forex4you analysts
Disclaimer:
Trading Futures and Options on Futures and Cash Forex transactions involves substantial risk of loss and may not be suitable for all investors. You should carefully consider whether trading is suitable for you in light of your circumstances, knowledge, and financial resources. You may lose all or more of your initial investment. Opinions, market data, and recommendations are subject to change at any time. |
|
|
|
|
|
| trevor_l |
Apr 25 2012, 01:51 PM
|
Junior Money Maker
Group: Members
Posts: 36
Dream Points: 230
Experience Points: 86
Joined: 11-April 12
Member No.: 268,237
|
Technical analysis 25th April 2012[i]
USD/CHF
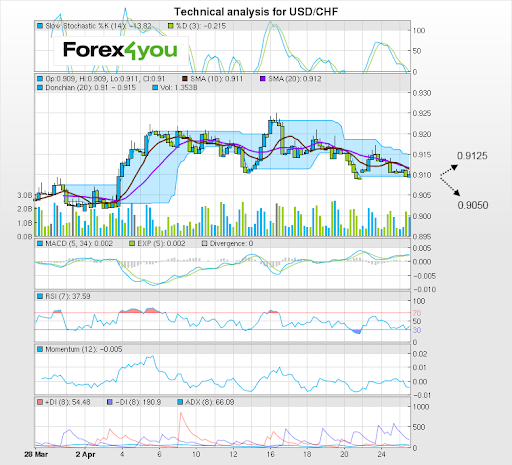
The daily chart is showing a large triangular formation unfolding but no clues as to which way it will break. The 4hr chart has a large head and shoulders pattern with bearish connotations and if it breaks down it will probably reach support at the lower line of the triangle at 0.9050. The recovery bounce currently unfolding on the hourly chart looks reasonably robust so there is also a possibility that it could reach resistance from the 50-day MA at the 0.9125 level, although at the moment there is still insufficient bias either way.
USD/JPY
The price keeps on testing a downtrend (blue) line as a resistance, but fails. Another bullish attack was held back by 81.50/60 resistance. Trading is currently carried out at 81.20/10 level. Indicators are unclear, but they seem to be turned more down, suggesting a possible decline to 80.60 level, which will give more grounds to anticipate another dissension to 79.90 level. 81.80/90 � 81.50/60 resistance range breakout will, on the other hand, indicate the bullish victory.
GBP/USD: further downside possible
Sterling has fallen sharply after hitting resistance from the monthly pivot at the 1.6162 highs as well as other major resistance lines from previous highs. It has moved out of the overbought region on momentum indicators and there is a strong possibility the move down could go deeper, initially to the cluster of support at 1.6030 and then perhaps if it is strong, to the 1.5955 level where the 50-day MA is situated and sure to lend support for a rebound.

EUR/USD: break lower probable
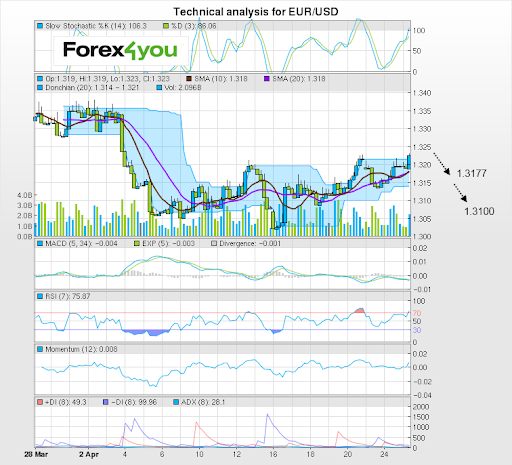
The EUR/USD pair has recovered with surprising strength and has rallied up to above the 1.3200 level. This is probably a correction of the previous wave and I expect it to reverse soon � probably before it gets above the previous highs at 1.3226. It has also hit resistance form the 50-day MA, reinforcing the bearish outlook. From here I see a break lower as the next Elliot wave down unfolds, first to the cluster of support at 1.3177 but then eventually to the 1.3100 major support level of a few days ago where the monthly pivot lies.
Analysis prepared by:
Joaquin Monfort and Arkady Nagiev
Forex4you analysts
Disclaimer:
Trading Futures and Options on Futures and Cash Forex transactions involves substantial risk of loss and may not be suitable for all investors. You should carefully consider whether trading is suitable for you in light of your circumstances, knowledge, and financial resources. You may lose all or more of your initial investment. Opinions, market data, and recommendations are subject to change at any time. |
|
|
|
|
|
|
|